1.
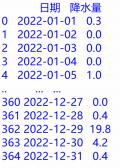
学校气象社团的小丽同学收集了当地 2023 年全年的天气数据,数据存储在“天气数据.xlsx”文件中,部分数据如图a所示。
 图a
图a
为分析该年部分气温情况,编写 Python程序,请回答下列问题:
(1)
计算 2023年的日均气温, 输出全年日均气温的最高值及出现日均气温最高值的所有日期,输出结果如图b所示。
(2)
统计月平均气温(当月每天日均气温的平均),并绘制如图c所示的线形图,实现该功能的程序如下,请在划线③、④处填入合适的代码。
 图b
图b
实现该功能的程序如下,请在划线①处填入合适的代码。
划线②处应选填入的代码为(单选,填字母)。
A .df1 B .df1.values C .df1.index
import pandas as pd
df=pd.read_excel(" ① ")
df["日均温"]=(df["最高气温℃"]+df["最低气温℃"])/2
df1=df.sort_values("日均温",ascending=False).日均温.head(1)
Max= ②
date=[ ]
for i in range(len(df)):
if df.at[i,"日均温"]==Max:
date.append(df.at[i,"日期"])
print("日均温最高值:"Max,"℃")
print("日期:",date)
 图c
图c
df["月份"]=""
for j in range(len(df)):
df.at[j,"月份"]=df.at[j,"日期"][5:7]
df2=df.groupby("月份",as_index=True).③
plt.plot(④,df2["日均温"],label="月均温" )
plt.xlabel("月份")
plt.ylabel("温度℃")
plt.legend()
plt.show()
【考点】
编程处理数据与可视化;
表格数据的图表呈现;
能力提升
 图a
图a 图b
图b 图c
图c

 图 c
图 c 图a
图a 图b
图b